Cheap GPS and Code Project Tutorial
January 28th, 2008 | Published in Programming | 9 Comments
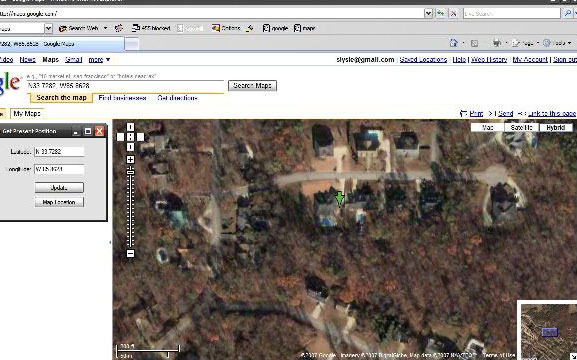
I came across a tutorial today on Code Project called “Mapping with a GPS and C#“. I then found this cheap usb GPS receiver on Amazon for $29. And so begins a new little project I would like to try out.
The NMEA 0183 Stream
What isn’t mentioned in the tutorial in any great depth is that NMEA stream coming from the reciever actually holds a lot more information than just the simple logitude and latitude of the reciever. Here is a list of some of the highlights:
- $GPAAM – Waypoint Arrival Alarm
- $GPBOD – Bearing, Origin to Destination
- $GPBWW – Bearing, Waypoint to Waypoint
- $GPGGA – Global Positioning System Fix Data
- $GPGLL – Geographic Position, Latitude/Longitude
- $GPGSA – GPS DOP and Active Satellites
- $GPGST – GPS Pseudorange Noise Statistics
- $GPGSV – GPS Satellites in View
- $GPHDG – Heading, Deviation & Variation
- $GPHDT – Heading, True
- $GPRMB – Recommended Minimum Navigation Information
- $GPRMC – Recommended Minimum Specific GPS/TRANSIT Data
- $GPRTE – Routes
- $GPVTG – Track Made Good and Ground Speed
- $GPWCV – Waypoint Closure Velocity
- $GPWNC – Distance, Waypoint to Waypoint
- $GPWPL – Waypoint Location
- $GPXTE – Cross-Track Error, Measured
- $GPXTR – Cross-Track Error, Dead Reckoning
- $GPZDA – UTC Date/Time and Local Time Zone Offset
- $GPZFO – UTC and Time from Origin Waypoint
- $GPZTG – UTC and Time to Destination Waypoint
So I was thinking about putting together a little bigger application together and utilizing more of the NMEA stream that would sync up with a website.


June 6th, 2009at 10:03 pm(#)
Hi,
I´m reading the same book, and I had an doubt.
In “Euclidean Distance Score” the autor have been used
a simple function:
>> sqrt(pow(5-4,2)+pow(4-1,2))
3.1622776601683795
The values used in the function, the author
have been talked to calculate the distance
between Toby and LaSalle in the chart on the
figure 2-1.
But in the chart Toby has Snakes 4.5 and Dupree to 1.0
and LaSalle 4.0 to Snakes and 2.0 to Dupree.
My question is:
Why he didn´t used this values as below.
D(Toby,LaSalle) =
>> sqrt(pow(1.0-2.0,2)+pow(4.5-4.0,2))
3.1622776601683795
Regards,
Soriano from Brazil
June 7th, 2009at 12:26 am(#)
Hey Soriano,
I think you are correct in pointing out this error. My guess is that probably got missed during editing.
Wikipedia has it stated as thus:
Two-dimensional distance
For two 2D points, P=(p_x,p_y)\, and Q=(q_x,q_y)\,, the distance is computed as:
\sqrt{(p_x-q_x)^2 + (p_y-q_y)^2}.
http://en.wikipedia.org/wiki/Euclidean_distance
So in python it should read as you’ve written it:
>> sqrt(pow(1.0-2.0,2)+pow(4.5-4.0,2))
1.11803398875
Good catch!
Eric
August 5th, 2009at 8:30 am(#)
Eric,
thank you very much for your answer. I spent one day trying to understand why my calculattions for Toy and LaSalle in the book do not match values i get.
Soriano,
Thank you very much for raising this issue so readers can find an answer on this page.
Nadya
September 1st, 2009at 6:45 pm(#)
Thanks very much, same book same error…
November 17th, 2009at 7:47 am(#)
interesting implementation!
April 17th, 2010at 1:02 am(#)
hi i need source code for k-means clustering algorithm for documents…in c#.plz any one have this code then send to my mail.Thanks in advance.
April 17th, 2010at 1:18 am(#)
Hey Salma – The k-means class on http://eric.ness.net/archives/k-means-document-clustering/ is in C#. Or over at http://www.codeproject.com/KB/recipes/K-Mean_Clustering.aspx. Let me know if you have any other questions.
February 23rd, 2011at 5:31 am(#)
Dear Eric,
I had a couple of problems with ur beautiful kmeans doc clus.
1. I hav Dundas Chart professional edition, which didnt support the following statements:
i. DataSet myDocs = Chart1.DataManipulator.ExportSeriesValues(“Series1″);
ii. DataSet myKMeansPoints = Chart1.DataManipulator.ExportSeriesValues(“Series3″);
So, I tried as follows:
DataSet myDocs = new DataSet();
DataTable dt1 = new DataTable(“Series1″);
myDocs.Tables.Add(dt1);
DataPoint temppt = Chart1.Series["Series1"].Points[0];
dt1.Columns.Add(“X”);
dt1.Columns.Add(“Y”);
for(int c=2; c<temppt.YValues.Length; c++)
dt1.Columns.Add("Y"+c);
for (int j=0;j<Chart1.Series["Series1"].Points.Count;j++)
{
DataPoint p = Chart1.Series["Series1"].Points[j];
DataRow row = dt1.NewRow();
row[0] = p.XValue;
for (int i = 0; i < p.YValues.Length; i++)
row[i+1] = p.YValues[i];
dt1.Rows.Add(row);
}
for both Series1[mydocs] and Series3[mykmeanspoints]
- now that compiled and gave me some gud results. Can u please evaluate my code.
2. after the above changes, if i remove the comments for
//double[,] myWords = mylsi.MyWords;
//PlotWords(myDocs, mylsi.MyWordsRowCount);
am getting indexoutofrange problem.
i observed that the matrix has 12 rows and 9 cols.
The problem is in PlotWords method:
private void PlotWords(double[,]myWords,int myWordsRowCount)
{
for (int i = 0; i size 9 X 2
// myWordsRowCount -> 12
// “Matrix words = reducedWordVector*reducedSigma” ???
}
…
Can u please help me out here !
April 19th, 2011at 9:54 am(#)
To Eric,
The clustering doesn’t seems to be work due to an error caused by imatrix maths operation…an unidentified assembly or reference not found being pointed out …
please help me out in this one..