UUorld Map Visualization
February 1st, 2010 | Published in Uncategorized
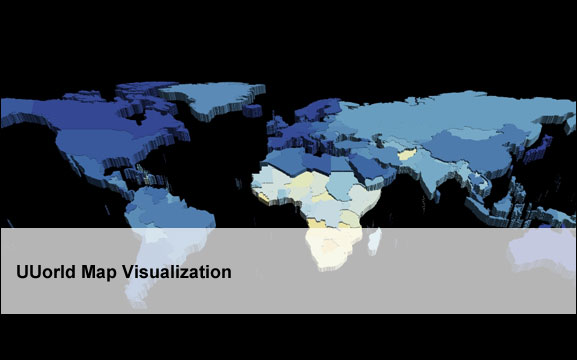
UUorld has quickly become one of my new favorite toys as of late. What is it? As the site explains it “provides an immersive mapping environment, high-quality data, and critical analysis tools.”
Here is just a simple result of what the map looks like:

Here are some of the highlights:
- Supports time series data
- Fairly extensive database to pull data from online (apparently of 10,000 different datasets)
- Create you own datasets via csv files
- Export to video
- Export to KML file for use in google maps/earth.
- Has the following border sets: Country, US States/Counties, US Zip Codes
There is one caveat that I feel I must add to not give the impression that all is rosy – I bought the application over a week ago and it took several e-mails for them to reply to me and finally get my full download.

Related Posts
Hexmap: Visualizing Geographic Data with Hexagonal BinningDotMap: Geographic Data Visualization Tool
Data Driven Maps Part 2: KML Choropleth Maps
Data Driven Maps Part 1: SVG Choropleth Maps
Map Resources