DotMap: Geographic Data Visualization Tool

December 3rd, 2024 | Published in Uncategorized
I recently join BlueSky and came across this post for a #30daymapchallenge.
Iva Brunec’s shared her R code and I ported it to Python, with some modifications. Essentitally it creates a stylized point-based visualizations of geographic data using shapefiles. It’s kind of cool! Anyway enjoy!
""" Geographic Data Visualization Tool This module provides functionality for creating stylized point-based visualizations of geographic data using shapefiles. It's particularly useful for creating distinctive visualizations of neighborhood or regional data. This is essentially a port of Iva Brunec's R code to Python, with some modifications https://bsky.app/profile/ivabrunec.bsky.socialhttps://github.com/ivabrunec/30daymapchallenge/tree/main/2024/day_24_circles With additional inspiration from the following sources: https://bsky.app/profile/karaman.is """ import geopandas as gpd import pandas as pd import matplotlib.pyplot as plt import numpy as np from shapely.geometry import Point import colorsys from typing import List, Dict, Tuple, Optional from pathlib import Path class GeoVisualizer: """A class to handle geographic data visualization with point-based mapping.""" def __init__(self, shapefile_path: str, feature_column: str, title: str): """ Initialize the GeoVisualizer with basic parameters. Args: shapefile_path: Path to the input shapefile feature_column: Column name containing the features to visualize title: Title for the visualization Raises: FileNotFoundError: If shapefile_path doesn't exist ValueError: If feature_column is not in the shapefile """ self.shapefile_path = Path(shapefile_path) self.feature_column = feature_column self.title = title if not self.shapefile_path.exists(): raise FileNotFoundError(f"Shapefile not found: {shapefile_path}") self.shp_data = gpd.read_file(shapefile_path) if feature_column not in self.shp_data.columns: raise ValueError(f"Column '{feature_column}' not found in shapefile") self.grid_points = None self.point_data = None self.color_dict = None def create_grid(self, spacing: int = 80, bbox: Optional[Tuple[float, float, float, float]] = None) -> None: """ Create a grid of points covering the geographic area. Args: spacing: Number of divisions for the width of the bounding box bbox: Optional custom bounding box (minx, miny, maxx, maxy) """ bbox = bbox or self.shp_data.total_bounds width = bbox[2] - bbox[0] circle_spacing = width / spacing x_points = np.arange(bbox[0], bbox[2], circle_spacing) y_points = np.arange(bbox[1], bbox[3], circle_spacing) xx, yy = np.meshgrid(x_points, y_points) grid_points = [Point(x, y) for x, y in zip(xx.ravel(), yy.ravel())] self.grid_points = gpd.GeoDataFrame(geometry=grid_points, crs=self.shp_data.crs) def perform_spatial_join(self) -> None: """Perform spatial join between grid points and shapefile polygons.""" self.point_data = gpd.sjoin( self.grid_points, self.shp_data, how='inner', predicate='within' ) @staticmethod def generate_distinct_colors(n: int) -> List[Tuple[float, float, float]]: """ Generate visually distinct colors using HSV color space. Args: n: Number of colors to generate Returns: List of RGB color tuples """ colors = [] golden_ratio = 0.618033988749895 for i in range(n): hue = (i * golden_ratio) % 1 saturation = 0.8 if i % 2 == 0 else 0.6 value = 0.9 if i % 3 == 0 else (0.7 if i % 3 == 1 else 0.5) colors.append(colorsys.hsv_to_rgb(hue, saturation, value)) return colors def create_color_mapping(self) -> None: """Create a color mapping for unique features in the data.""" unique_features = sorted(self.point_data[self.feature_column].unique()) colors = self.generate_distinct_colors(len(unique_features)) self.color_dict = dict(zip(unique_features, colors)) def create_visualization( self, marker_size: int = 10, output_path: str = 'visualization.png', dpi: int = 300, legend_columns: int = 2, background_color: str = '#333333' ) -> None: """ Create and save the final visualization. Args: marker_size: Size of the point markers output_path: Path to save the output image dpi: Resolution of the output image legend_columns: Number of columns in the legend background_color: Background color of the plot """ if self.point_data is None or self.color_dict is None: raise ValueError("Must run create_grid(), perform_spatial_join(), " "and create_color_mapping() before visualization") fig, ax = plt.subplots(figsize=(10, 14)) ax.set_facecolor(background_color) fig.patch.set_facecolor(background_color) # Plot points for each unique feature unique_features = sorted(self.point_data[self.feature_column].unique()) for feature in unique_features: mask = self.point_data[self.feature_column] == feature self.point_data[mask].plot( ax=ax, color=self.color_dict[feature], marker='o', markersize=marker_size, label=feature, alpha=0.9 ) # Customize plot appearance ax.set_axis_off() title = ax.set_title( self.title, pad=10, color='white', fontsize=24, fontweight='bold', loc='left', bbox=dict(facecolor=background_color, edgecolor=background_color), fontname='Arial' ) # Add and customize legend leg = ax.legend( bbox_to_anchor=(0.5, -0.1), loc='center', ncol=legend_columns, frameon=False ) for text in leg.get_texts(): text.set_color('white') text.set_fontsize(10) # Save visualization plt.savefig( output_path, dpi=dpi, bbox_inches='tight', facecolor=background_color, pad_inches=0.5 ) plt.close() def main(): """Example usage of the GeoVisualizer class.""" try: # Create DC neighborhoods visualization visualizer = GeoVisualizer( shapefile_path='data3/Neighborhood_Clusters.shp', feature_column='NBH_NAMES', title='DC Neighborhoods' ) # Create Soils of Canada visualization ''' visualizer = GeoVisualizer( shapefile_path='data2/Soils_of_Canada.shp', feature_column='SurfMat', title='Soils_of_Canada' ) ''' visualizer.create_grid(spacing=80) visualizer.perform_spatial_join() visualizer.create_color_mapping() visualizer.create_visualization( marker_size=10, output_path='dc_neighborhoods_map.png' ) print("Visualization created successfully!") except Exception as e: print(f"Error creating visualization: {str(e)}") if __name__ == "__main__": main()Day 24 of #30daymapchallenge: circular shapes only. Soil types of Canada, in point form. w/ thanks to @karaman.is for the pixel point approach I borrowed here! Code: github.com/ivabrunec/30...
— Iva Brunec (@ivabrunec.bsky.social) 2024-11-24T23:07:03.050Z
The full repository: https://github.com/Eric-Ness/DotMap
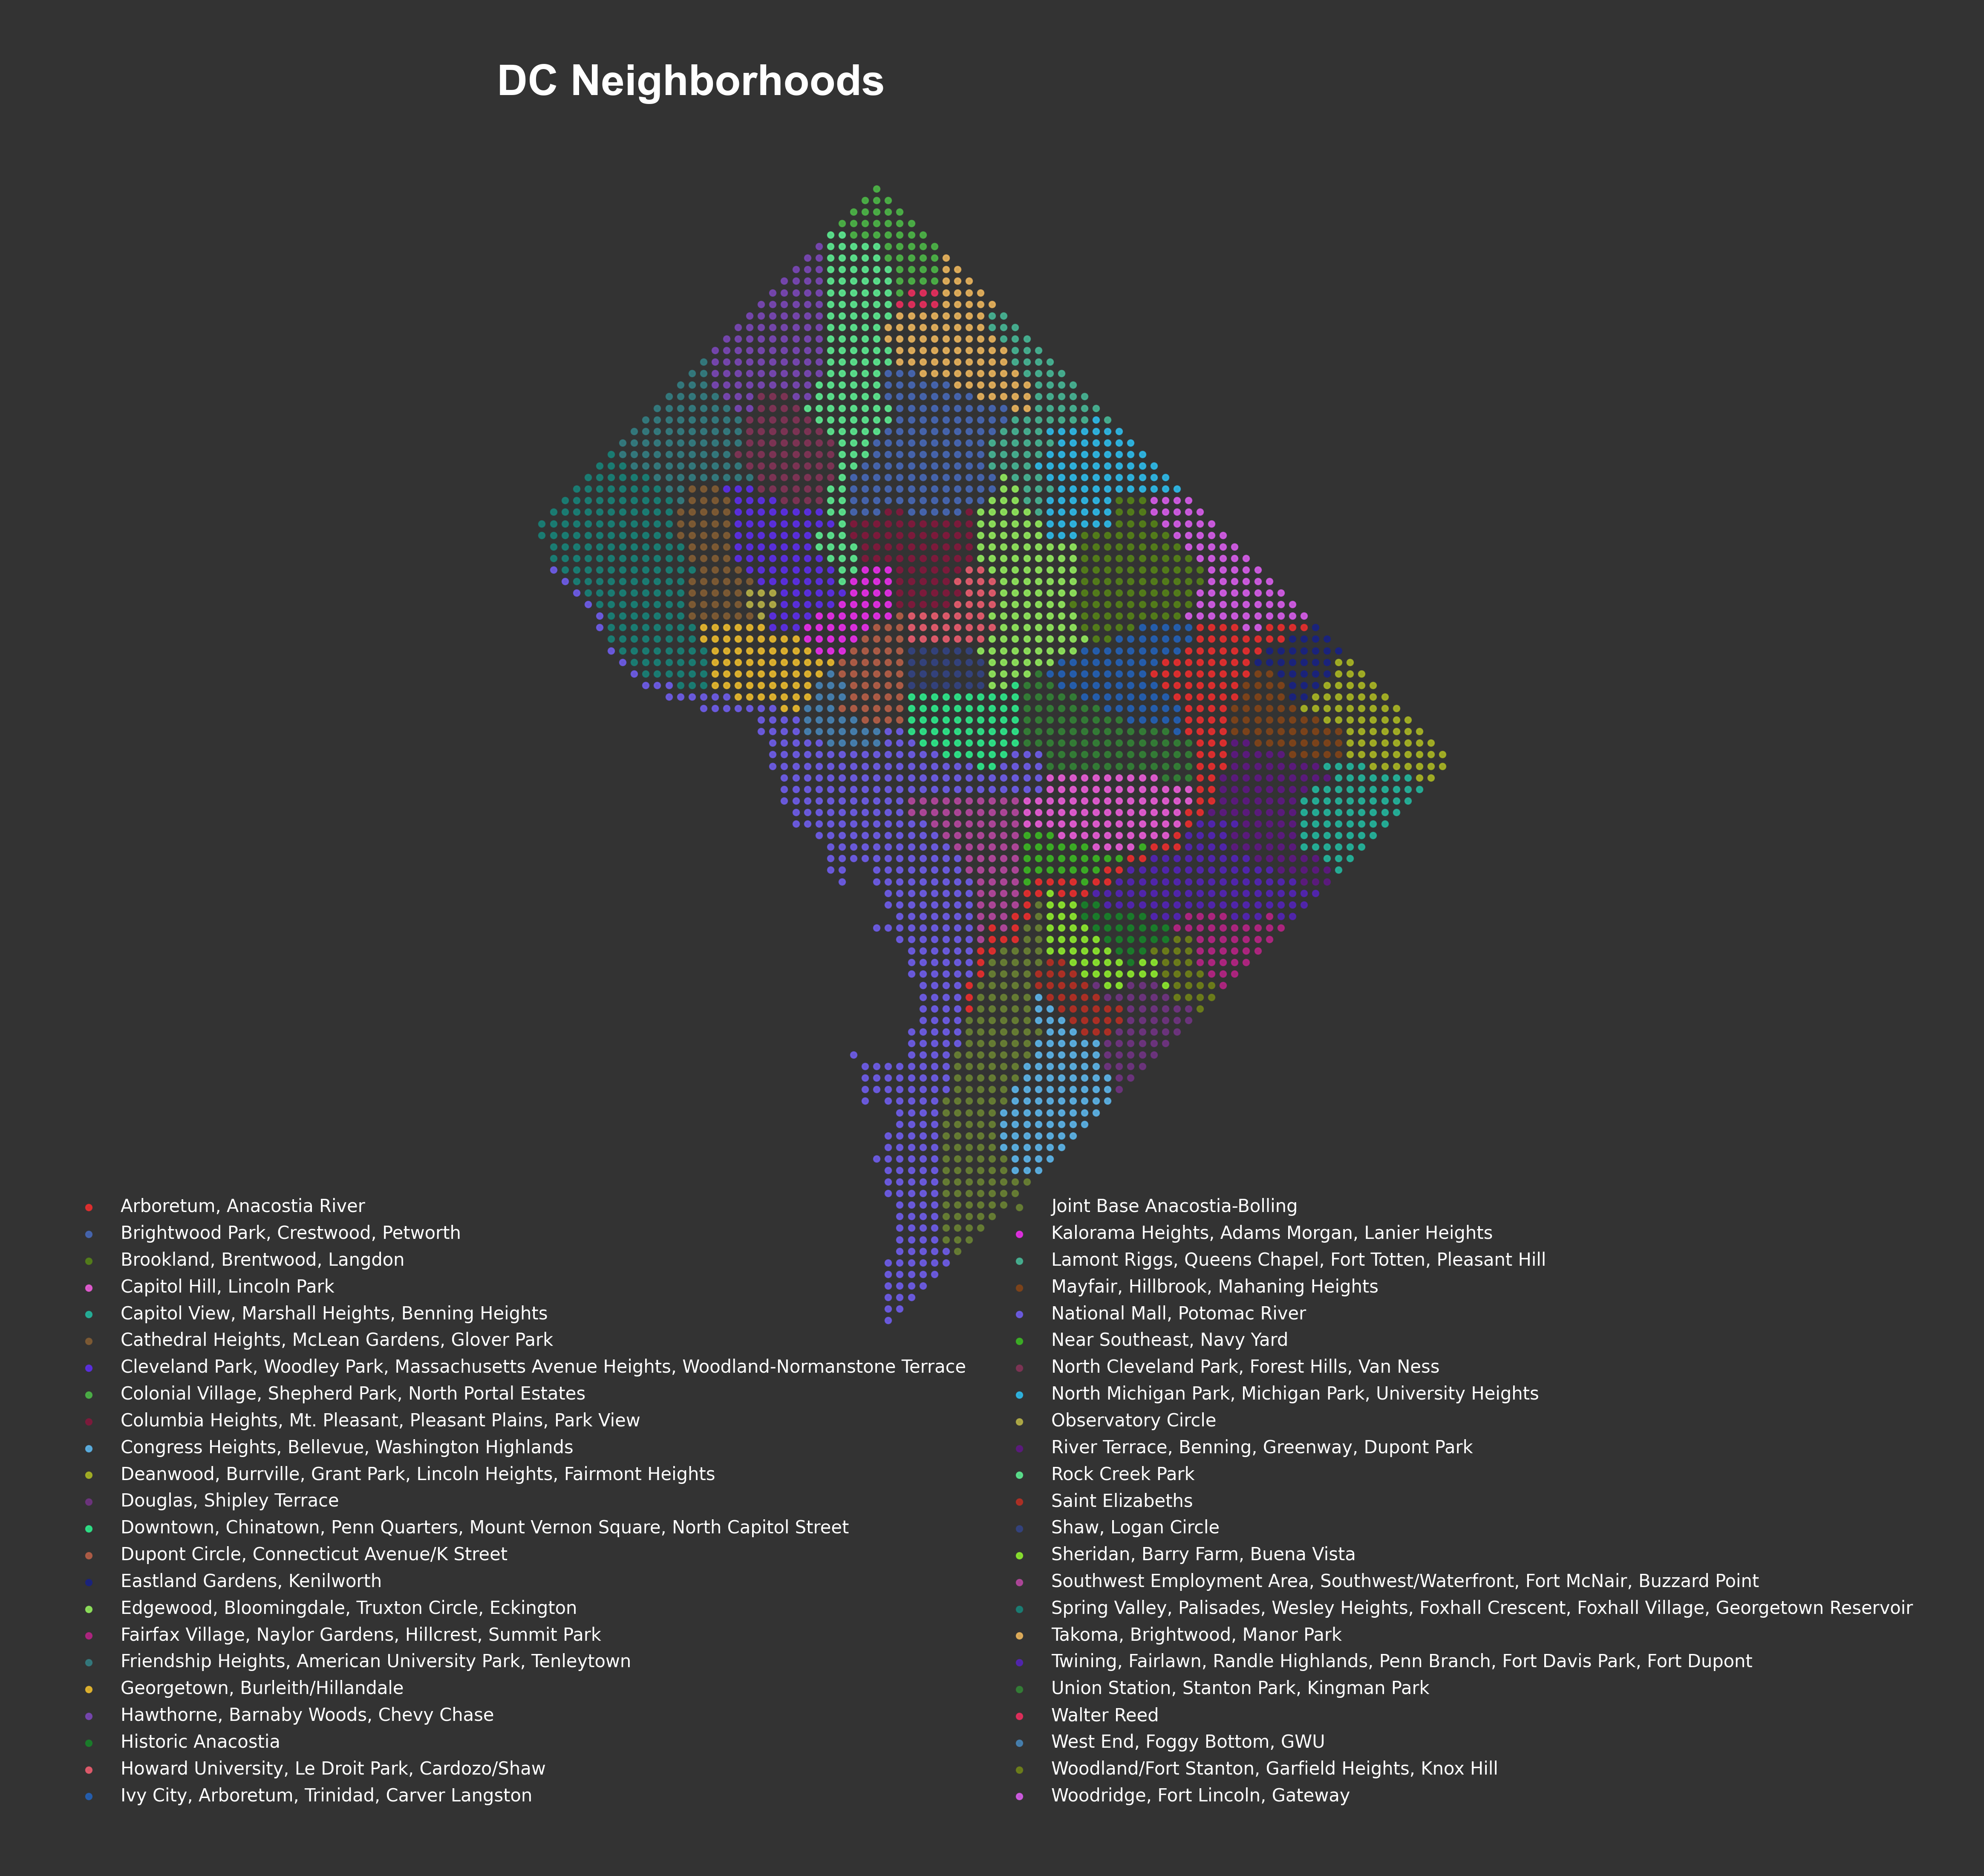
And the result!

Related Posts
Hexmap: Visualizing Geographic Data with Hexagonal BinningData Driven Maps Part 2: KML Choropleth Maps
Data Driven Maps Part 1: SVG Choropleth Maps
UUorld Map Visualization
Map Resources