Data Driven Maps Part 1: SVG Choropleth Maps
March 15th, 2012 | Published in Visualization
Over the next couple of blog posts I would like to focus on displaying data on a map via the web. There are a number off the shelf options for your desktop that do a great job, one or two that we’ve talked about before. But, presenting data over the web often presents us with a couple of challenges – specifically data size.
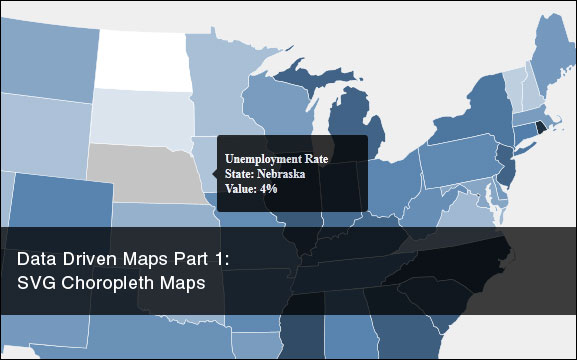
One of my favorite ways to show data on a map is via a choropleth map. A choropleth map is essentially a shaded area of map that is correlated to some value. In this blog we are going to talk specifically about manipulating an SVG file in to a choropleth map.
SVG map files are great for a couple of reasons, specifically: they can be displayed in most modern browsers, can be edited in image editing software like Adobe Photoshop or (free) Inkscape and with javascript we can manipulate individual paths/areas.
Because this specific SVG file is more or less static we are not going to really look at it other than to say that each shape has a two letter state id – for instance ‘MN’ is for Minnesota.
The first bit of code I would like to look at is our json code. Specifically, we have the name of the state, the two letter code, and our data. The data is the current Unemployment Rate for each state.
var states =
			[{"name": "Alabama", "state": "AL", "value": 7.8},
			{"name": "Alaska", "state": "AK", "value": 4.2},
			{"name": "Arizona", "state": "AZ", "value":	8.7},
			{"name": "Arkansas", "state": "AR", "value": 7.6},
			{"name": "California", "state": "CA", "value": 10.9},
			{"name": "Colorado", "state": "CO", "value": 7.8},
			{"name": "Connecticut", "state": "CT", "value": 8},
			{"name": "Delaware", "state": "DE", "value": 7},
			{"name": "District of Columbia", "state": "DC", "value": 9.9},
			{"name": "Florida", "state": "FL", "value":	9.6},
			{"name": "Georgia", "state": "GA", "value":	9.2},
			{"name": "Hawaii", "state": "HI", "value": 6.5},
			{"name": "Idaho", "state": "ID", "value": 8.1},
			{"name": "Illinois", "state": "IL", "value": 9.4},
			{"name": "Indiana", "state": "IN", "value":	8.7},
			{"name": "Iowa", "state": "IA", "value": 5.4},
			{"name": "Kansas", "state": "KS", "value": 6.1},
			{"name": "Kentucky", "state": "KY", "value": 8.8},
			{"name": "Louisiana", "state": "LA", "value": 6.9},
			{"name": "Maine", "state": "ME", "value": 7},
			{"name": "Maryland", "state": "MD", "value": 6.5},
			{"name": "Massachusetts", "state": "MA", "value": 6.9},
			{"name": "Michigan", "state": "MI", "value": 9},
			{"name": "Minnesota", "state": "MN", "value": 5.6},
			{"name": "Mississippi", "state": "MS", "value":	9.9},
			{"name": "Missouri", "state": "MO", "value": 7.5},
			{"name": "Montana", "state": "MT", "value": 6.5},
			{"name": "Nebraska", "state": "NE", "value": 4},
			{"name": "Nevada", "state": "NV", "value": 12.7},
			{"name": "New Hampshire", "state": "NH", "value": 5.2},
			{"name": "New Jersey", "state": "NJ", "value": 9},
			{"name": "New Mexico", "state": "NM", "value": 7},
			{"name": "New York", "state": "NY", "value": 8.3},
			{"name": "North Carolina", "state": "NC", "value": 10.2},
			{"name": "North Dakota", "state": "ND", "value": 3.2},
			{"name": "Ohio", "state": "OH", "value": 7.7},
			{"name": "Oklahoma", "state": "OK", "value": 6.1},
			{"name": "Oregon", "state": "OR", "value": 8.8},
			{"name": "Pennsylvania", "state": "PA", "value": 7.6},
			{"name": "Rhode Island", "state": "RI", "value": 10.9},
			{"name": "South Carolina", "state": "SC", "value": 9.3},
			{"name": "South Dakota", "state": "SD", "value": 4.2},
			{"name": "Tennessee", "state": "TN", "value": 8.2},
			{"name": "Texas", "state": "TX", "value": 7.3},
			{"name": "Utah", "state": "UT", "value": 5.7},
			{"name": "Vermont", "state": "VT", "value": 5},
			{"name": "Virginia", "state": "VA", "value": 5.8},
			{"name": "Washington", "state": "WA", "value": 8.3},
			{"name": "West Virginia", "state": "WV", "value": 7.4},
			{"name": "Wisconsin", "state": "WI", "value": 6.9},
			{"name": "Wyoming", "state": "WY", "value": 5.5}];
The second piece of javascript does four main things: find the min/max of the data, calculates and sets the color, create popup text and mouse over/out actions.
// our min/max values
var min, max;

$(function() {
	// loads the states data
	 loadStates();
});

function loadStates() {
	// set the first items as min/max
	min = states[0].value;
	max = states[0].value;

	// find the min & max in the json data
	for(var i = 0; i < states.length; i++) {
		if(states[i].value < min) { min = states[i].value; }
		if(states[i].value > max) { max = states[i].value; }
	}

	// set states
	for(var i = 0; i < states.length; i++) {
		var value = states[i].value; 		// value
		var abbr = states[i].state;			// state code
		var myName = states[i].name;		// state name
		var color = '#' + getColor(value);	// static color option
		color = getColor2(value);			// color shaded as a %

		// Color state
		$('#' + abbr).css('fill', color);
		$('#' + abbr).css('stroke', 'white');
		$('#' + abbr).css('stroke-width', '0.5');

		// Add tipsy overlay
		$('#' + abbr).attr('title', buildTipsyBox(myName, value));
		$('#' + abbr).tipsy({gravity: 'w', html: true });

		// Add mouse over events
		mapMouseOver($('#' + abbr), color, myName, abbr, value);
		mapMouseOut($('#' + abbr), color);
	}
}

// Addmouse over event
function mapMouseOver(p, color, name, abbr, value) {
	p.mouseover(function() {
		// animate to gray
		p.css('fill', color).animate({opacity: 0.25}, 5 );
		p.css('fill', "#999999").animate({opacity: 0.5}, 100 );

		// show values
		$('#StateName').html(name);
		$('#StateAbbr').html(abbr);
		$('#value').html(value);
	});
}

// Add mouse out event
function mapMouseOut(p, color) {
	p.mouseout(function() {
		// re-set color
		p.css('fill', color).animate({opacity: 1}, 100 );

		// clear values
		$('#StateName').html('');
		$('#StateAbbr').html('');
		$('#value').html('');
	});
}

// Build the tipsy box html
function buildTipsyBox(name, value) {
	var text = '<h3>Unemployment Rate<br />';
	text += "State: " + name + "<br />";
	text += "Value: " + value + "%";
	text += '</h3>';
	return text;
}

// Static color option
function getColor(code) {
	var itemColor;
	if (code == 1) itemColor = "b9c5d1";
	if (code == 2) itemColor = "9fb6c8";
	if (code == 3) itemColor = "74a2bc";
	if (code == 4) itemColor = "4785ac";
	if (code == 5) itemColor = "25689d";
	if (code == 6) itemColor = "084886";
	if (code == 7) itemColor = "08295c";
	return itemColor;
}

// Color option based as a percentage
function getColor2(code) {
	var p = (code - min)/(max - min);
	var rgb = setColor(p);
	return rgb;
}

// Gets shade as a percentage of a hue
function setColor(p){
    var continuousScale = d3.scale.linear().domain([1, 7]).range([0, 1]);
	var hue = 210; //blue
	var hex = d3.hsl(hue, .35, 1 - p)
	return hex;
}
Here is what it ends up looking like.

View the result live here! Download the files here.
[Extended from EJ Fox piece, ‘How to Make Choropleth Maps in D3‘]