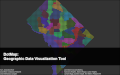
Hexmap: Visualizing Geographic Data with Hexagonal Binning
February 26th, 2025 by eric
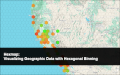
Hexmaps a insightful geographic visualizations.
February 26th, 2025 by eric
Hexmaps a insightful geographic visualizations.
December 3rd, 2024 by eric
A stylized map using shapefiles.
April 20th, 2012 by eric
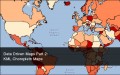
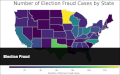
Create KML choropleth maps for Google Map overlay.
March 15th, 2012 by eric
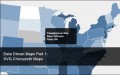
One of my favorite ways to show data on a map is via a choropleth map using an SVG file.
March 10th, 2012 by eric
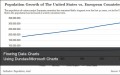
My code to generate a Flowing Data type chart.
February 1st, 2010 by eric
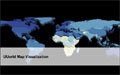
UUorld has quickly become one of my new favorite toys as of late.
November 26th, 2009 by eric
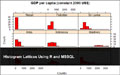
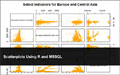
Creating Histogram Lattices Using R and MSSQL