Hexmap: Visualizing Geographic Data with Hexagonal Binning
February 26th, 2025 | Published in Personal
Introduction
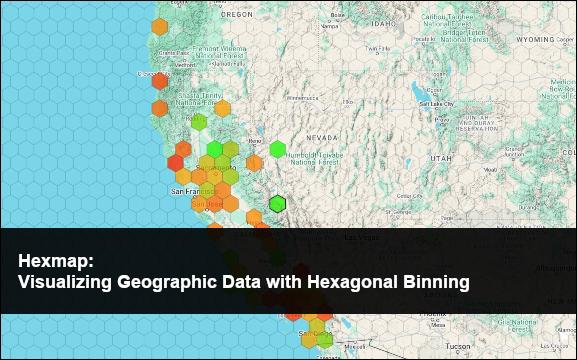
In the world of data visualization, representing geographic information effectively can be challenging. Traditional approaches like point markers often become cluttered and less informative as data points increase. This is where hexagonal binning shines.
Our Hexmap project combines the powerful mapping capabilities of Google Maps with D3.js’s hexagonal binning to create a more meaningful representation of geographic data. The result is a visualization that not only shows where data points are located but also provides immediate visual cues about data density and values through color intensity.
Project Background
This project builds upon Josh Carr’s excellent Google Maps + D3 + hexbin implementation (https://gist.github.com/joshcarr/c0a405243d3051a9c986). While his original work demonstrated the core concept, our variation adds several improvements:
1. Extended hex grid coverage for better data context
2. Responsive zoom functionality that maintains visual integrity at different scales
3. Simplified data structure for easier customization
4. Interactive hover elements that reveal detailed information
5. Enhanced security through proper API key management
The goal was to create a tool that makes geographic data patterns immediately apparent while preserving the ability to drill down into specific details.
Technical Overview
Hexmap leverages two powerful libraries: Google Maps API for the base mapping functionality and D3.js for the data visualization layer. The magic happens at the intersection of these technologies.
The hexagonal binning technique groups nearby points into hexagonal cells, with each cell’s color intensity representing either the number of points it contains or a value derived from those points. This approach offers several advantages over traditional markers:
– Reduced visual clutter when dealing with many data points
– More efficient pattern recognition through color gradients
– Clearer representation of data density
– Improved visual aesthetics through uniform shapes
Under the hood, the implementation uses Google Maps’ overlay functionality combined with D3’s hexbin algorithm to position the hexagons correctly as the map pans and zooms.
Key Features
Interactive Hexagonal Grid
The hexagonal grid dynamically adjusts to the map’s viewport, ensuring that hexagons maintain appropriate size and positioning regardless of zoom level. This creates a consistent visual experience while exploring the data.
Zoom Functionality
Unlike some map visualizations that break down when zooming, Hexmap recalculates the hexagonal grid at different zoom levels. This maintains visual integrity while allowing users to explore data at various scales.
Simplified Data Format
The project uses a straightforward JSON format for location data, making it easy to replace the sample airport data with custom datasets:
"KSFO": [-122.38, 37.62, "SAN FRANCISCO INTERNATIONAL AIRPORT", [35]]
This simple format—with longitude, latitude, name, and value—makes the tool highly adaptable to different use cases.
Hover Interactions
The interactive layer allows users to hover over hexagons to reveal detailed information about the contained data points. This creates a two-level information architecture: the broad patterns visible at a glance, with specific details available on demand.
Secure API Key Handling
The updated implementation separates sensitive API credentials from the codebase, using a configuration file that’s excluded from version control. This follows security best practices while maintaining ease of deployment.
Implementation Highlights
The heart of Hexmap is its ability to translate geographic coordinates into hexagonal bins. This is accomplished through several key components:
1. Overlay Creation: A custom Google Maps overlay provides the canvas for D3 to draw upon
2. Coordinate Mapping: Geographic coordinates are converted to pixel space for consistent visualization
3. Hexagonal Binning: D3’s hexbin algorithm groups nearby points efficiently
4. Color Scaling: A linear scale maps data values to colors, creating the visual gradient
5. Event Handling: Mouseover events connect the visual layer to the information panel
One particularly elegant aspect is how the system handles zooming. Rather than simply scaling the existing grid (which would distort the visualization), Hexmap recalculates the entire grid at new zoom levels, ensuring that the hexagons accurately represent the data at every scale.
Security Considerations
A critical improvement in our implementation is the secure handling of API credentials. The Google Maps API key is sensitive information that should never be hardcoded or committed to public repositories.
Our solution implements several best practices:
1. Storing the API key in a separate configuration file
2. Including this file in .gitignore to prevent accidental exposure
3. Providing a template configuration file for documentation
4. Loading the API key dynamically at runtime
This approach significantly reduces security risks while maintaining ease of use for developers.
Customization Options
Hexmap was designed with customization in mind. Here are some ways to adapt it to different needs:
Data Customization
The stations.json file can be replaced with any dataset following the same structure. This makes it easy to visualize different types of geographic information:
– Retail store locations with sales data
– Population centers with demographic information
– Environmental readings from monitoring stations
– Traffic data across a city
Visual Customization
The code allows for easy modification of visual elements:
– Color scales can be adjusted to match brand guidelines or improve contrast
– Hexagon size can be modified to highlight different levels of detail
– The information panel can be customized to show relevant data points
Functional Extensions
The core implementation can be extended with additional features:
– Filtering capabilities to focus on specific data subsets
– Time-based animations to show changes over time
– Additional overlays for multi-dimensional data
Use Cases
The versatility of hexagonal binning makes Hexmap suitable for a wide range of applications:
Density Visualization
Hexagons naturally communicate areas of concentration, making this ideal for visualizing:
– Population density across regions
– Customer concentration for business analysis
– Traffic patterns throughout a transportation network
Value Comparison
The color gradient allows for quick comparison of values across a geographic area:
– Sales performance by region
– Environmental measurements across a study area
– Response times for emergency services
Pattern Recognition
Hexagonal grids excel at revealing patterns that might be obscured in point-based visualizations:
– Disease spread patterns for epidemiology
– Urban development trends for city planning
– Resource usage patterns for utility companies
Conclusion
Hexmap represents a significant improvement over traditional point-based geographic visualizations. By combining the mapping power of Google Maps with the visualization capabilities of D3.js, we’ve created a tool that makes complex geographic data more accessible and meaningful.
The addition of security improvements and enhanced documentation makes this project not just powerful but also practical for real-world applications. Whether you’re visualizing business data, scientific measurements, or social patterns, the hexagonal binning approach offers clear advantages in pattern recognition and information density.
We invite contributions and customizations to the project. Geographic data visualization is a rich field with many possibilities, and we’re excited to see how others might extend and improve upon this foundation.
Resources
– Project repository: https://github.com/Eric-Ness/hexmap
– D3.js hexbin plugin: https://github.com/d3/d3-hexbin
– Google Maps JavaScript API: https://developers.google.com/maps/documentation/javascript/overview
– Hexagonal binning background: https://en.wikipedia.org/wiki/Hexagonal_binning
Related Posts
DotMap: Geographic Data Visualization ToolData Driven Maps Part 2: KML Choropleth Maps
Data Driven Maps Part 1: SVG Choropleth Maps
UUorld Map Visualization
Map Resources