Scatterplots Using R and MSSQL
November 27th, 2009 | Published in Uncategorized
As an extension of yesterdays post here is another fairly cool chart you can do in R. For this little sample we are using the same data as before but for my sql query I have to do a crosstab query. So lets take a look at the code:
# includes
library(RODBC)
# create connection
channel <- odbcConnect("HealthDB")
# query database
myData <- sqlQuery(channel, "SELECT Country AS 'Country', Year AS 'Year', [96741] AS 'GDP growth (annual %)--WDI-2009', [96841] AS 'GDP per capita (constant 2000 US$)--WDI-2009', [99941] AS 'Population growth (annual %)--WDI-2009', [100041] AS 'Population, total--WDI-2009' FROM ( SELECT DISTINCT CountryID, Country, Year, IndicatorID, IndValue FROM [Time Series Data] WHERE ( ((IndicatorID) = 96741) OR ((IndicatorID) = 96841) OR ((IndicatorID) = 99941) OR ((IndicatorID) = 100041)) AND (((CountryID) = 4118) OR ((CountryID) = 4125) OR ((CountryID) = 4129) OR ((CountryID) = 4134) OR ((CountryID) = 4141) OR ((CountryID) = 4145) OR ((CountryID) = 4164) OR ((CountryID) = 4186) OR ((CountryID) = 4213) OR ((CountryID) = 4327) OR ((CountryID) = 4219) OR ((CountryID) = 4221) OR ((CountryID) = 4227) OR ((CountryID) = 4230) OR ((CountryID) = 4243) OR ((CountryID) = 4326) OR ((CountryID) = 4268) OR ((CountryID) = 4272) OR ((CountryID) = 4273) OR ((CountryID) = 4325) OR ((CountryID) = 4300) OR ((CountryID) = 4308) OR ((CountryID) = 4309) OR ((CountryID) = 4311) OR ((CountryID) = 4316)) AND (NOT (Year IS NULL)) AND (Year >= 1960) AND
(Year <= 2007))
ps
PIVOT (
MAX(IndValue)
FOR IndicatorID IN ([96741], [96841], [99941], [100041] ) )
AS
pvt
order by Country, Year")
#close connection
odbcClose(channel)
#Plot charts
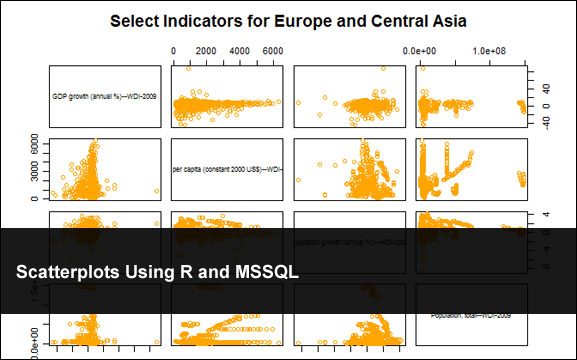
plot(myData[3:6], col="orange", main="Select Indicators for Europe and Central Asia")
Here is the result
