Histogram Lattices Using R and MSSQL
November 26th, 2009 | Published in Uncategorized
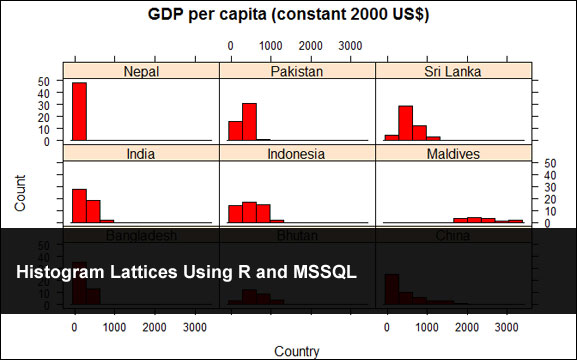
After getting Joseph Adler’s book “Baseball Hacks” I’ve been wanting to get in to R. R is simply an amazing open source statistics/graphing application. For this example we are going pull data from a MSSQL database and make a histogram lattice of a couple of countries.
First, I pulled the data from HealthSystems2020 time series database and imported the data in to MSSQL. I did some minor touch ups to the database giving the indicator an id etc. The second thing you need to do is create an ODBC connection for your database here is a fairly good tutorial. In this example I called my ODBC DSN “HealthDB”. Also make sure you adjust you sql query so that they are pulling the correct names/values.
Finally, here is the code:
# includes
library(RODBC)
library(lattice)

# create connection
channel <- odbcConnect("HealthDB")

# query database
myData <- sqlQuery(channel, "SELECT Country, IndValue
FROM         [YOURTABLE]
WHERE     (id = 96841) AND (
(Country = 'Afghanistan') OR
(Country = 'Bangladesh') OR
(Country = 'Bhutan') OR
(Country = 'India') OR
(Country = 'Maldives') OR
(Country = 'Nepal') OR
(Country = 'Pakistan') OR
(Country = 'China') OR
(Country = 'Indonesia') OR
(Country = 'Sri Lanka'))")

#close connection
odbcClose(channel)

#create histogram
histogram(~ myData[,3] | myData[,1], type="count", col="red", main = "GDP per capita (constant 2000 US$)", xlab="Country")
And here is the result:
