Monte Carlo Simulations in C#
May 23rd, 2011 | Published in Uncategorized | 1 Comment
Let me say I am a huge fan of Monte Carlo Simulations. For those of you who are not familiar with Monte Carlo Simulations – Monte Carlo Simulations use random numbers and a model to simulate an outcome or event but the real strength in Monte Carlo Simulations is that you repeat the simulation hundreds if not thousands of times. After running the simulation, the results as a whole give you some great insight in to possible outcomes you can expect. The results are often more robust and accurate than other methods like regressions.
For this tutorial, I am going to replicate the core functionality of this report from Lumenaut. The model itself has a couple of fixed costs: Labor, Price per Widget and Rent. The model also has two variable items: Variable Cost per Widget and Number of Widgets Sold. So just like in real life if I want to figure out how much profit I am going to make I need to subtract my total costs from my revenue.

But, where we see the strength of a Monte Carlo Simulation is that it says let’s take a look at this model again but, maybe I can buy my widgets a little cheaper and maybe I can sell a couple more. In addition, every month is a little different some you sell a couple more some a couple of less.
To simulate this we need to use some random numbers but a normal random number generator will not work because that will give us a uniform distribution. Some random number for a Monte Carlo Simulation needs to have very specific distributions: normal, log, triangular, gamma, or something else to better simulate real life. The React.NET library gives us a very easy simple way to simulate all of these very easily.
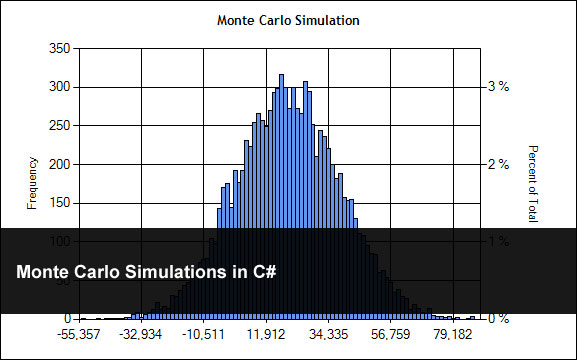
So for Lumenaut’s model we need two normal distribution random number generators and the profit model outlined in the excel table and following graph. Please note that the Cost Per Widget is 5 with a standard deviation of 0.5 and the Number of Widgets Sold is 2,000 with a standard deviation of 200.

Here is the code I use.
using System.Collections.Generic;
using React.Distribution;

namespace MonteCarloSimulation.Models
{
    ///
<summary>
    /// Monte Carlo Simulation
    /// </summary>

    public class MonteCarloModel
    {
        private const double FixedCost = 170000;
        private const double FixedSellingPrice = 100;
        private readonly double _costPerWidget;
        private readonly double _costPerWidgetSd;
        private readonly double _numOfSimulations;
        private readonly double _numOfWidgetSd;
        private readonly double _numOfWidgets;
        public int NumberOfSimulations = 10000;
        public List<double> RESULTS = new List<double>();

        ///
<summary>
        /// Initializes a new instance of the <see cref="MonteCarloModel"/> class.
        /// </summary>

        /// <param name="costPerWidget">The cost per widget.</param>
        /// <param name="costPerWidgetSd">The cost per widget sd.</param>
        /// <param name="numOfWidgets">The num of widgets.</param>
        /// <param name="numOfWidgetSd">The num of widget sd.</param>
        /// <param name="numOfSimulations">The num of simulations.</param>
        public MonteCarloModel(double costPerWidget,
                               double costPerWidgetSd,
                               double numOfWidgets,
                               double numOfWidgetSd,
                               double numOfSimulations)
        {
            _costPerWidget = costPerWidget;
            _costPerWidgetSd = costPerWidgetSd;
            _numOfWidgets = numOfWidgets;
            _numOfWidgetSd = numOfWidgetSd;
            _numOfSimulations = numOfSimulations;
            Run();
        }

        ///
<summary>
        /// Runs the Monte Carlo Simulation
        /// </summary>

        private void Run()
        {
            // Set up our Normal distributions with the mean, and the Standard Deviation
            var costPerWidgetDist = new Normal(_costPerWidget, _costPerWidgetSd);
            var numberOfWidgetDist = new Normal(_numOfWidgets, _numOfWidgetSd);

            for (int i = 0; i < _numOfSimulations; i++)
            {
                // Get the next ranom number for our model
                double costPerWidget = costPerWidgetDist.NextDouble();
                double numberOfWidgetsSold = numberOfWidgetDist.NextDouble();

                // Calculate the revenue
                double revenue = numberOfWidgetsSold*FixedSellingPrice;

                // Calculate the costs
                double cost = (costPerWidget*numberOfWidgetsSold + FixedCost);

                // Add result to our results list
                RESULTS.Add(revenue - cost);
            }
        }
    }
}
Here is a little display I put together and as you can see, the results are very similar; they will not be exactly the same as there is a random component to all of this.

Note:
There are a number of things to note here:
- This is nowhere near production code (read as good code) – it is simply for you to look at and get you going down the road to Monte Carlo Simulations. I think I spent all of 30 minutes putting it together so don’t expect anything nice and neat. 🙂
- I had to remove the Dundas graphing library, as I cannot distribute it per my license. But, it should work just fine with the Microsoft graphing library.
- Enjoy!
Related Posts
AI-Powered News Aggregator for BlueskyExploring Negative r2 in Ablation Studies
Starting a Ph.D. in Computer Science
Cryptanalysis Using n-Gram Probabilities
Apriori Algorithm