Election Fraud: A Deep(ish) Dive
January 27th, 2024 | Published in Personal
Now that I have had time to play around with the data, I want to collect my thoughts on what the data means.
Q1: How good is the Heritage Foundation Voter Fraud Dataset?
The data set is pretty excellent. In many ways, it reminds me of the Iraqi Body Count [1] and the Washington Post’s Fatal Force Database [2]. These datasets use news reports to collect and quantify their areas of interest. Counting things, regardless of the topic, can often take time and effort. Nevertheless, the Heritage Foundation does an excellent job of capturing the data [3].
It should be noted that the site states the data ‘presents a sampling of recent proven instances of election fraud from across the country’ and that the ‘database is not an exhaustive or comprehensive list.’ Moreover, it is ‘intended to demonstrate the vulnerabilities in the election system and the many ways in which fraud is committed.’
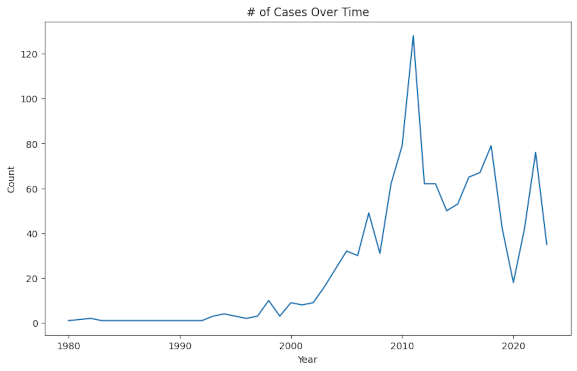
Even though the data set is incomplete, one could make the case that it captures a relatively good scope of this issue within the last couple of years. For instance, since about the mid-2000s, it has been relatively steady.
Q2: How prevalent is voter fraud?
An excellent place to start would be to see how many votes have been cast since the 1980s to get a sense of how bad voter fraud is. The Election Project [4] has one of the more complete datasets available for download. I went to their website to compile all the voting data I could since the 1980s, and in my estimation, 1,795,549,467 votes have been cast (not including primaries).
It should also be noted that even though there are 1,161 records in the voter fraud database, some items include more than one person. In fact, one record shows ’63 Individuals’, but most of them are about a single individual. On the Heritage Foundation Web Site, it tends to suggest that approximately 1,500 people have been brought before a court for voter fraud.
Since there is a difference between the number of records and the total number of people involved, one way to correct this is through a multiplier. For example, if there are 1,161 records in the database but it includes a multiplier of 1.3, we would get the following:
1,161 * 1.3 = 1,509
This puts the number of records and the total number of people in the database on the same page.
Here, it brings us to the main question: How prevalent is voter fraud? Here are the results using various multipliers.
Total Votes Cast: 1,795,549,467
Total Cases of Voter Fraud: 1,161
------------------------------------------------------------------
Total Cases of Voter Fraud (with a multiplier of x 1.3): 1,509
Percentage of Votes Cast that are Fraudulent: 0.00008404%
------------------------------------------------------------------
Total Cases of Voter Fraud (with a multiplier of x 250): 290,250
Percentage of Votes Cast that are Fraudulent: 0.01616497%
------------------------------------------------------------------
Total Cases of Voter Fraud (with a multiplier of x 15465): 17,954,865
Percentage of Votes Cast that are Fraudulent: 0.99996493%
------------------------------------------------------------------
So, as the database is, it would suggest that for any given election, we should expect about 0.00008404% of them to be fraudulent. This is effectively zero, that there is no voter fraud issue in the United States.
Another great thing about using a multiplier is that we could hypothetically run through scenarios where individuals engaged in voter fraud but never got caught. So, with a multiplier of 250, we see something that may affect close elections. If we have a multiplier of 15,465, we expect about 1% of the vote to be fraudulent. However, the multiplier means that for every case of fraud that gets published, we are missing 15,465 other cases.
Put another way, is it reasonable to believe that for every case that we know about, are there hypothetically another 50, 100, 250, or 15,000 cases that we do not know about or are not in the database? Probably not. So this suggests, at least from what we can gather, that voter fraud is a statistical rarity.
Q3: Who commits more voter fraud? Democrats or Republicans?
The way we approached this was to look at how many records contained the words ‘Democrat’ and ‘Republican.’ We did this using the applymap function for the pandas dataframes. As a backup, we searched the CSV file and did a total count as a backup.
Using the applymap method, the word ‘Democrat’ appeared 124 times (or 10.58% of the time). The word ‘Republican’ appeared 59 times (or 5.08% of the time). The search method produced roughly the same ratio but did not use it, as one record could mention the keywords multiple times.
So, it appears that Democrats engage in higher rates of voter fraud. However, one should approach this claim with a healthy dose of skepticism, as most records do not indicate the individual’s political affiliation. Political affiliation mentioned in the records almost always is in the form of ‘[individual] a Democratic/Republican candidate engaged in voter fraud.’ So, this is an unusual subset of people you would not generally expect to see in the records.
------------------------------------------------------------------
Number of times the word 'Democrat' appears in the case description:
ID              0
State           0
Year            0
Name            1
Case Type       0
Fraud Type      0
Outcomes      124
Source          0
dtype: int64
The word 'Democrat' seems to appear in the csv file a total of 150 times.

------------------------------------------------------------------
Number of times the word 'Republican' appears in the case description:
ID             0
State          0
Year           0
Name           0
Case Type      0
Fraud Type     0
Outcomes      59
Source         0
dtype: int64
The word 'Republican' seems to appear in the csv file a total of 63 times.
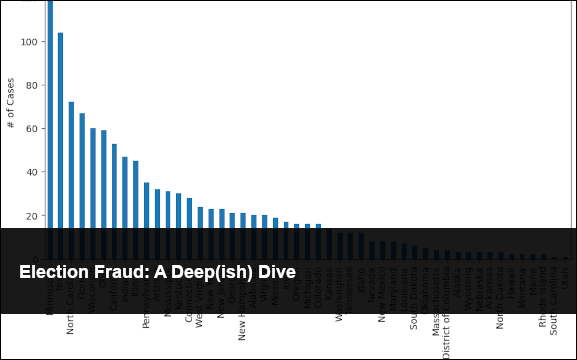
Q4: What is wrong with Minnesota and other geographic observations?
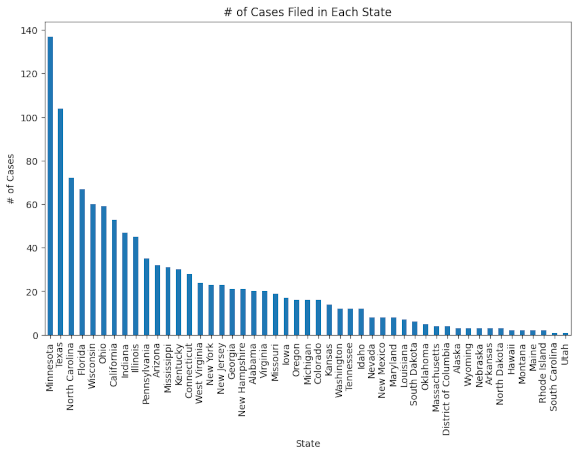
As someone originally from Minnesota, I feel free to say WTF Minnesota. Compared to the average state, Minnesota is off the charts. This might mean one of two things: either my fellow Minnesotans enjoy engaging in voter fraud at rates that would make other states blush, or there are internal mechanisms that catch higher rates of voter fraud.
Other states with a relatively high number of cases include Texas, North Carolina, Florida, Wisconsin, Ohio, California, Indiana, and Illinois. Notably, six of these nine states are generally considered conservative. So maybe when considering whether Democrats or Conservatives engage in voter fraud, this might be evidence to the contrary.
Q5: What is the rate for prior felony conviction?
Several States in the US make it illegal for individuals with prior felony convictions to vote in elections. Several advocates in this field state that these policies are there to disenfranchise people who have largely paid their debt to society and are often just part of a more extensive operation to make it harder for various people to vote.
Using the same approach in question three, we searched for the term ‘convicted felon.’ The data suggest that approximately 62 records show that an individual with a prior felony conviction tried to vote. This accounts for 5.34% of all records in the database.
Finally, if this topic interests you, it is worth your time to read the individual records as it gives you more insight into the repercussions of what some consider an unjust law.
------------------------------------------------------------------
Number of times the word 'convicted felon' appears in the case description:
ID             0
State          0
Year           0
Name           0
Case Type      0
Fraud Type     0
Outcomes      62
Source         0
dtype: int64
The word 'convicted felon' seems to appear in the csv file a total of 66 times.
My code and data
As always you can check out my github repository for the data and the code. https://github.com/Eric-Ness/ElectionFraud [5]
Also please check out my other blog post about this topic [6].
References
[1] https://www.iraqbodycount.org/
[2] https://github.com/washingtonpost/data-police-shootings
[3] https://www.heritage.org/voterfraud
[4] https://www.electproject.org/election-data/voter-turnout-data
[5] https://github.com/Eric-Ness/ElectionFraud
[6] https://eric.ness.net/2024/01/26/election-fraud/
Related Posts
Exploring Negative r2 in Ablation StudiesElection Fraud
Monte Carlo Simulations in C#
Apriori Algorithm
Scatterplots Using R and MSSQL