Election Fraud
January 26th, 2024 | Published in Personal
In order to switch gears for a second, I sometimes like to work on something completely different. A while back, I was looking to see if there was a dataset that covered voter fraud. To my surprise, there is, and the Heritage Foundation developed and maintains it and I must say that it is actually a fairly good data set.
So there are two sections to this blog post: building a web scraper to gather the data and then a little section doing some simple analysis to see what we can say about the data. I should state that the data comes from https://www.heritage.org/voterfraud.
Web Scraper
The web scraper is relatively straightforward. Here, I am just using the BeautifulSoup library, going through the rows of data, saving them to a data frame, and then exporting the data to a CSV file.
def run():
    """
    Scrapes and prints information about voter fraud cases from a website.

    This function sends a request to a website, downloads the HTML contents,
    parses the HTML using BeautifulSoup, and extracts information about voter
    fraud cases from the parsed HTML. It then prints the extracted information.

    Note: This function assumes that the required modules (BeautifulSoup and requests)
    have been imported.

    Returns:
    None
    """
    # Request to website and download HTML contents
    url = 'https://www.heritage.org/voterfraud-print/search'
    req = requests.get(url)
    content = req.text

    # parse the html using beautiful soup and store in variable `soup`
    soup = BeautifulSoup(content, 'html.parser')

    # Get the table
    table = soup.find_all('div', attrs={'class': 'views-row'})
    extra = soup.find_all('div', attrs={'class': 'extra-row'})

    # Initialize count
    count = 0

    # Remove extra records
    extra_records = 14

    # Create a dataframe
    df = pd.DataFrame(columns=['ID', 'State', 'Year', 'Name', 'Case Type', 'Fraud Type', 'Outcomes', 'Source'])

    # Print each row
    for row in table[1:(len(table)-extra_records)]:
        state = get_row_state(row)
        year = get_row_year(row)
        name = get_row_name(row)
        case_type = get_row_case_type(row)
        fraud_type = get_row_fraud_type(row)
        outcomes = get_row_outcomes(extra, count)
        source = get_row_source(extra, count)

        df = df._append({
            'ID': str(count + 1),
            'State': state,
            'Year': year,
            'Name': name,
            'Case Type': case_type,
            'Fraud Type': fraud_type,
            'Outcomes': outcomes,
            'Source': source},
            ignore_index=True)

        print('State: ', state)
        print('Year: ', year)
        print('Name: ', name)
        print('Case Type: ', case_type)
        print('Fraud Type: ', fraud_type)
        print('Outcome: ', outcomes)
        print('Source: ', source)
        print('-----------------')
        count = count + 1

    # Print dataframe
    print(df.head())

    # Save dataframe to csv
    df.to_csv('data/voter_fraud_cases.csv', index=False)
This code produces as csv file that looks like the following.
ID,State,Year,Name,Case Type,Fraud Type,Outcomes,Source
1,Alabama,2023,David Cole,Criminal Conviction,False Registrations,"David Cole, a Republican member of the Alabama House of Representatives from the 10th District, was charged by the state with one felony count of false registration after falsely claiming he resided in Alabama’s 10th state house district during the 2022 Primary and General Election. He also voted in 2022 in the 10th district even though he lived in District 4. Just before filing, Cole entered into a $5-per-month lease at a home in District 10, which he never occupied, although he registered that as his voting address and had mail sent there. Cole falsely claimed that he sold his District 4 house. Cole's crime came to light during his campaign to represent AL-10 in the state's House of Representatives, but did not conclude until after the election, which Cole won by 973 votes. He pleaded guilty to knowingly voting in a location for which he was not authorized, was sentenced to 60 days in Madison County jail and three years of probation, agreed to resign from his legislative seat,  and was ordered to pay $52,885.79 in restitution (all the money he made while employed as a Representative). A new election was held on December 12, 2023.","'herit.ag/47e4toi, herit.ag/479QgIU, herit.ag/3GUPxRw'"
2,Arizona,2023,Gloria Lopez Torres,Criminal Conviction,Fraudulent Use Of Absentee Ballots,"Gloria Lopez Torres, a San Luis City Councilwoman, was charged by the state with felony counts of conspiracy and ballot abuse after trafficking absentee ballots during the August 2020 primary election as part of a larger ballot harvesting scheme. Torres picked up 7 ballots from Nadia Lizarraga-Mayorquin (who was also charged and convicted) and put them into a drop box in 2020. Arizona law only permits family members and close relatives to do this. Torres pleaded guilty to one count of ballot abuse and was sentenced to 24 months of probation and fined $2,500. She may not run or be appointed to public office again, but she was allowed to finish her current term ending in December 2024.","'herit.ag/4aFU4Vw, herit.ag/4aK3Mq0, herit.ag/3NOw8p0, herit.ag/3tEqRcL'"
3,Arizona,2023,Nadia Guadalupe Lizarraga-Mayorquin…,Criminal Conviction,Fraudulent Use Of Absentee Ballots,"Nadia Lizarraga-Mayorquin (aka Nadia Buchanan) of San Luis was charged by the state with felony counts of conspiracy and ballot abuse after trafficking absentee ballots during the August 2020 Primary election as part of a larger ballot harvesting scheme. Arizona law only permits family members and close relatives to do this. Lizarraga-Mayorquin trafficked at least 7 ballots to Gloria Lopez and at least one ballot herself from a third party. She pleaded guilty to one misdemeanor count of ballot abuse and was sentenced to 24 months of probation and fined $2,500.","'herit.ag/47nHwiw, herit.ag/3vtrbeS, herit.ag/47nHEP2, herit.ag/3S5dfke'"
4,Connecticut,2023,Bridgeport Municipal Mayoral Democratic…,Judicial Finding,Fraudulent Use Of Absentee Ballots,"The results of the City of Bridgeport, Connecticut Democratic mayoral primary election, which was held on September 12, 2023, were overturned due to absentee ballot fraud in an election where only 251 votes separated the winner (Joseph Ganim) and the loser (John Gomes). Superior Court Judge William Clark ordered that a new primary election between Ganim (the party-endorsed candidate) and Gomes (the challenger) should be held because an unusually large number of absentee ballots that were counted had been illegally placed in drop boxes by two unauthorized ballot distributors who were Ganim supporters: Wanda Geter-Pataky (a Democratic Town Committee member and the Leader of Voting District 136) and Eneida Martinez (a candidate for City Council). The court determined that videos of Geter-Pataky and Martinez illegally dropping off stacks of votes into various drop boxes “provided evidence of ballot harvesting, in violation of state law.” Geter-Pataky made 10 drops either directly or indirectly, and Martinez made 5 separate drops of multiple ballots. The court also found “the volume of ballots mishandled is such it calls the result of the primary election in serious doubt and unable to determine the legitimate result of the primary.”",'herit.ag/3TBYUNy'
5,District of Columbia,2023,Jessica Miser,Official Finding,Duplicate Voting,"Jessica Miser was fined $100 by the D.C. Board of Elections after voting twice in the 2020 general election, once in Maryland and a second time in D.C.",'herit.ag/41xmL2B'
6,District of Columbia,2023,Eddie Bishop,Official Finding,Duplicate Voting,Margaretta Sibert-Dean was fined $100 by the D.C. Board of Elections after voting twice in the 2020 general election once in Maryland and a second time in D.C.,'herit.ag/3RAsS1y'
7,District of Columbia,2023,Vanessa Rubio,Official Finding,Duplicate Voting,"Vanessa Rubio (a D.C. Advisory Neighborhood Commissioner) was fined $500 by the D.C. Board of Elections after voting twice in the 2020 general election, once in Maryland and second time in D.C",'herit.ag/3RR9Bdz'
8,District of Columbia,2023,Renee M. Diggs ,Official Finding,Duplicate Voting,"Renee Diggs was fined $100 by the D.C. Board of Elections after voting twice in the 2020 general election, once in Maryland and a second time in D.C.",'herit.ag/3RB5FfX'
9,Florida,2023,Michael Anderson,Criminal Conviction,Ineligible Voting,"Michael Anderson was charged by the state in Hillsborough County with one count of election voting by an unqualified voter and one count of false swearing after registering and voting in the 2020 General Election. He was ineligible as a felon with a prior sex offense conviction whose right to vote had not been restored. Anderson pleaded guilty to one count of voting by an unqualified voter. He was sentenced to 6 months of probation, and he was assessed $560 in fees, penalties, and court costs.","'https://herit.ag/478rdY4, https://herit.ag/3Oh8O2F'"
10,Florida,2023,Nathan Hart ,Criminal Conviction,Ineligible Voting,"Nathan Hart, 49, was charged by the state in Hillsborough County with two felonies, voting as an unqualified voter and false swearing. Hart was a felon whose right to vote had not yet been restored.  He was acquitted by a jury on the charge of illegally voting, but found guilty of lying on his voter registration application. Hart was sentenced to 24 months of probation, 100 hours of community service, and assessed $701 in court costs.","'https://herit.ag/41y8dip, https://herit.ag/40yAzIg, https://herit.ag/40vvro1'"
....
Analysis
The analysis section is also straightforward. Here, we are just creating a notebook and doing some simple analysis. The one piece of code that I want to point out is the map.
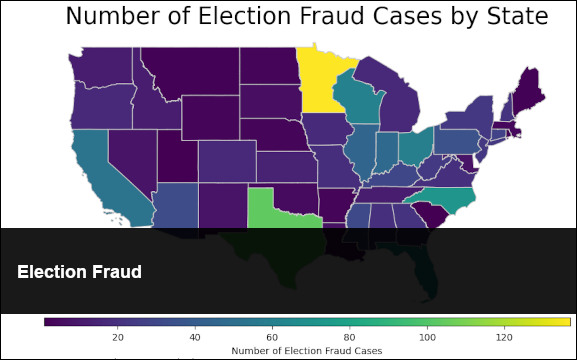
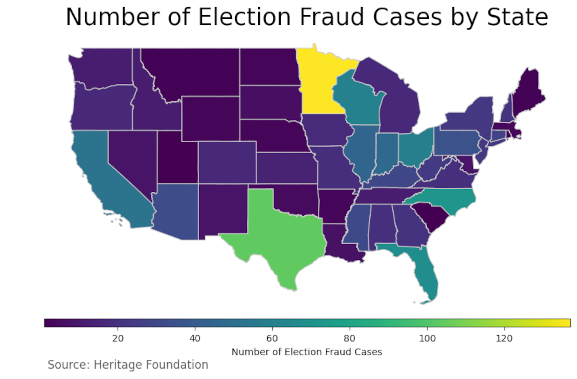
# Number of Election Fraud Cases by State

# Load the shapefile data
states = geopandas.read_file('shape_file/tl_2012_us_state.shp')

# Setup map
states = states.to_crs("EPSG:3395")
states = states[states['STUSPS'].isin(['AL', 'AR', 'AZ', 'CA', 'CO', 'CT',
                                       'DE', 'FL', 'GA', 'IA', 'ID', 'IL',
                                       'IN', 'KS', 'KY', 'LA', 'MA', 'MD',
                                       'ME', 'MI', 'MN', 'MO', 'MS', 'MT',
                                       'NC', 'ND', 'NE', 'NH', 'NJ', 'NM',
                                       'NV', 'NY', 'OH', 'OK', 'OR', 'PA',
                                       'RI', 'SC', 'SD', 'TN', 'TX', 'UT',
                                       'VA', 'VT', 'WA', 'WI', 'WV', 'WY'])]

# Merge the counts with the shapefile data
counts = df['State'].value_counts()
states = states.merge(counts, left_on='NAME', right_index=True)

fig, ax = plt.subplots(1, figsize=(10, 6))

# Create a divider for the colorbar
divider = make_axes_locatable(ax)
cax = divider.append_axes("bottom", size="3%", pad=0.01)

# Plot the map with color based on counts
states.plot(
    cmap='viridis',
    column='count',
    figsize=(15, 10),
    legend=True,
    cax=cax,
    legend_kwds={"label": "Number of Election Fraud Cases", "orientation": "horizontal"},
    linewidth=0.8, ax=ax, edgecolor='0.8'
    );

# remove the axis
ax.axis('off')

# add a title
ax.set_title(
    'Number of Election Fraud Cases by State',
     fontdict={'fontsize': '25', 'fontweight' : '2'}
     )

# create an annotation for the data source
ax.annotate(
    'Source: Heritage Foundation',
    xy=(0.07, .05),
    xycoords='figure fraction',
    horizontalalignment='left',
    verticalalignment='top',
    fontsize=12,
    color='#555555'
    )
This gives us the following chart.
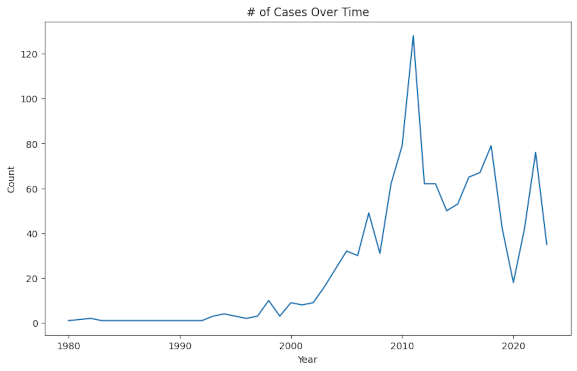
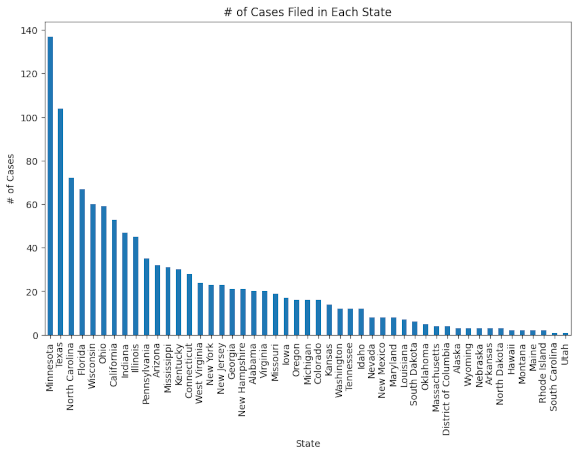
Other Charts
And here are two other interesting charts—a time series of cases and the number of offenses per state.
My Code
The following link contains the complete repository for you to play around with and download.
https://github.com/Eric-Ness/ElectionFraud
Next
In my next blog post I would like to discuss some findings regarding this dataset and do some further analysis. You can read it here: Election Fraud: A Deep(ish) Dive
Related Posts
AI-Powered News Aggregator for BlueskyDotMap: Geographic Data Visualization Tool
Colab pyodbc Install & Usage for MSSQL Server
Starting a Ph.D. in Computer Science
Online Virtual Machine Development