Flowing Data Charts Using Dundas/Microsoft Charts
March 10th, 2012 | Published in Uncategorized
Nathan Yau’s site Flowing Data is really one of my favorite sites on visualization. His recent book Visualize This is pretty much a required book if you do a lot of work with data, charts and visualization. I’ve always liked the approach Yau has taken with his charts as it has a slightly different feel than something you’d see Edward Tufte, Stephen Few or Dona Wong (all of whom I love) would do.
Anyway I’ve been slowly changing my charts to have more of a Flowing Data type layout and thought I would share some code. The goal here is to get as close to Nathan’s style using the Dundas / Microsoft Charting libraries as possible using ASP.NET MVC Framework.
Here is a typical Flowing Data chart [scanned from Visualize This]:

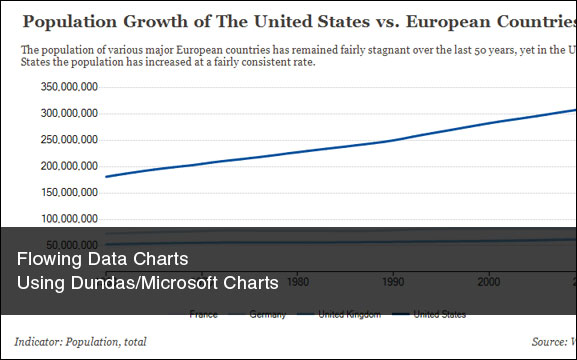
Here is my result:

So lets take a look at some of the code!
My MVC Charts class creates a generic chart object that gets us fairly down the road to Nathan’s layout.
using System.Drawing;
using Dundas.Charting.WebControl;

namespace FlowingData.Models
{
    public class MVCCharts
    {
        ///
<summary> /// Creates the flowing data chart.
 /// </summary>
        ///The width.
        ///The height.
        ///The title.
        ///The nar.
        ///The ind.
        ///The sour.
        ///
        public Chart CreateFlowingDataChart(int width, int height, string title, string nar, string ind, string sour)
        {
            // Inital Setup
            var chart1 = new Chart
                             {
                                 Width = width,
                                 Height = height,
                                 RenderType = RenderType.ImageTag,
                                 Palette = ChartColorPalette.Dundas,
                                 BorderColor = ColorTranslator.FromHtml("#E8E8E8"),
                                 BorderWidth = 1,
                                 BorderLineStyle = ChartDashStyle.Solid
                             };

            // Add title
            var t = new Title(title, Docking.Top, new Font("Georgia", 16, FontStyle.Bold), Color.FromArgb(68, 65, 61));
            chart1.Titles.Add(t);
            chart1.Titles[0].Alignment = ContentAlignment.TopLeft;

            // Add Narrative
            var narrative = new Title(nar, Docking.Top, new Font("Georgia", 10, FontStyle.Regular),
                                      Color.FromArgb(68, 65, 61));
            chart1.Titles.Add(narrative);
            chart1.Titles[1].Alignment = ContentAlignment.TopLeft;

            // Add Indicator
            var indicator = new Title(ind, Docking.Bottom, new Font("Georgia", 10, FontStyle.Italic),
                                      Color.FromArgb(68, 65, 61));
            chart1.Titles.Add(indicator);
            chart1.Titles[2].Alignment = ContentAlignment.BottomLeft;
            chart1.Titles[2].Position.Y = 97;
            chart1.Titles[2].Position.X = 2;
            chart1.Titles[2].Position.Width = 40;

            // Add Source
            var source = new Title(sour, Docking.Bottom, new Font("Georgia", 10, FontStyle.Italic),
                                   Color.FromArgb(68, 65, 61));
            chart1.Titles.Add(source);
            chart1.Titles[3].Alignment = ContentAlignment.BottomRight;

            // Add Chart Area
            chart1.ChartAreas.Add("Area1");

            // Add Legends
            chart1.Legends.Add("Legend1");
            chart1.Legend.Alignment = StringAlignment.Center;
            chart1.Legend.Docking = LegendDocking.Bottom;

            // Add Dashes
            chart1.ChartAreas[0].AxisY.MajorGrid.LineStyle = ChartDashStyle.Dot;
            chart1.ChartAreas[0].AxisY.MajorTickMark.LineStyle = ChartDashStyle.Dot;
            chart1.ChartAreas[0].AxisY.MajorGrid.LineColor = Color.Silver;
            chart1.ChartAreas[0].AxisY.MajorTickMark.LineColor = Color.Silver;
            chart1.ChartAreas[0].AxisY.MajorGrid.LineWidth = 1;
            chart1.ChartAreas[0].AxisY.LineWidth = 0;
            chart1.ChartAreas[0].AxisY.LabelStyle.Format = "#,###";

            // Remove Vertical Lines
            chart1.ChartAreas[0].AxisX.MajorGrid.LineStyle = ChartDashStyle.NotSet;

            return chart1;
        }
    }
}
My chart model essentially adds a series for each country, adds the country to that data, and then some last minute minor chart settings and colors.
using System;
using System.Drawing;
using System.Linq;
using Dundas.Charting.WebControl;

namespace FlowingData.Models
{
    public class ChartModel
    {
        #region Variables

        private readonly FlowingDataDBDataContext _db = new FlowingDataDBDataContext();

        #endregion

        #region Create Chart

        ///
<summary> /// Creates the chart.
 /// </summary>
        ///The chart.
        public void CreateChart(Chart chart)
        {
            try
            {
                // Get Distinct List Of Names
                var names = (from t in _db.Populations
                             select new {t.Country}).Distinct();

                foreach (var country in names)
                {
                    // Get Country Name
                    var country1 = country;

                    // Get Country Data
                    IOrderedQueryable data = (from t in _db.Populations
                                                          where t.Country == country1.Country
                                                          orderby t.Year ascending
                                                          select t);

                    // Add series and set chart type
                    chart.Series.Add(country.Country);
                    chart.Series[country.Country].Type = SeriesChartType.Line;
                    chart.Series[country.Country].BorderWidth = 3;
                    SetColor(chart, country.Country);

                    // Add data points
                    foreach (Population population in data)
                    {
                        chart.Series[population.Country].Points.AddXY(population.Year,
                                                                      population.Population__total__WDI_2011);
                    }

                    // Load Chart Settings
                    ChartSettings(chart);
                }
            }
            catch (Exception ex)
            {
                throw new Exception("Error: " + ex.Message);
            }
        }

        #endregion

        #region Misc

        ///
<summary> /// Charts the settings.
 /// </summary>
        ///The chart.
        private void ChartSettings(Chart chart)
        {
            // X axis settings
            chart.ChartAreas[0].AxisX.Minimum = 1960;
            chart.ChartAreas[0].AxisX.Interval = 10;
        }

        ///
<summary> /// Sets the color.
 /// </summary>
        ///The chart.
        ///Name of the country.
        private void SetColor(Chart chart, string countryName)
        {
            // Color chooser
            switch (countryName)
            {
                case "United States":
                    chart.Series[countryName].Color = ColorTranslator.FromHtml("#08519C");
                    break;
                case "United Kingdom":
                    chart.Series[countryName].Color = ColorTranslator.FromHtml("#6BAED6");
                    break;
                case "Germany":
                    chart.Series[countryName].Color = ColorTranslator.FromHtml("#BDD7E7");
                    break;
                case "France":
                    chart.Series[countryName].Color = ColorTranslator.FromHtml("#EFF3FF");
                    break;
            }
        }

        #endregion
    }
}
In the charts controller class you’d set the charts title, narrative, source, indicator and then return it as a file result.
using System;
using System.Collections.Generic;
using System.IO;
using System.Linq;
using System.Web;
using System.Web.Mvc;
using Dundas.Charting.WebControl;
using FlowingData.Models;

namespace FlowingData.Areas.api.Controllers
{
    public class chartsController : Controller
    {
        #region Variables

        readonly MVCCharts _charts = new MVCCharts();
        readonly ChartModel _model = new ChartModel();

        #endregion

        #region Get Chart

        ///
<summary> /// Getcharts this instance.
 /// </summary>
        ///
        public FileResult getchart()
        {
            // Set Titles
            const string title = "Population Growth of The United States vs. European Countries";
            const string indicator = "Indicator: Population, total";
            const string source = "Source: WDI-2011";
            const string narrative = "The population of various major European countries has remained " +
                                     "fairly stagnant over the last 50 years, yet in the United States " +
                                     "the population has increased at a fairly consistent rate.";

            // Create Chart
            Chart myChart = _charts.CreateFlowingDataChart(800, 450, title, narrative, indicator, source);

            // Load Chart
            _model.CreateChart(myChart);

            // Return File
            var myRand = new Random();
            var imageStream = new MemoryStream();
            myChart.Save(imageStream, ChartImageFormat.Png);
            return File(imageStream.ToArray(), "image/png", myRand.Next() + ".png");
        }

        #endregion
    }
}
…and that is it – easy peasey.
You can download the files (including the ms sql backup file) here. [I had to remove the Dundas library but you should be able to simply substitute the Microsoft version. In the code you would have to change the using Dundas.Charting.WebControl to the Microsoft library but that should be about it.]
Related Posts
ASP.NET MVC LinksHaack MVC Video: Cross-site Request Forgery Attack
Problems with Html.DropDownList
Updating Drop Downs w/ ASP.NET MVC and jQuery