Plotting Documents & Words: Using Latent Semantic Indexing

November 5th, 2009 | Published in Uncategorized
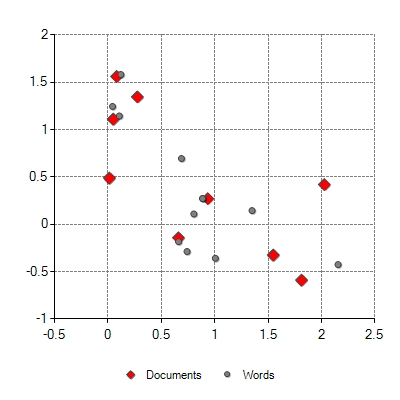
In the last blog post we looked over a couple of great papers talking about using Singular Value Decomposition (SVD) to do Latent Semantic Indexing (LSI) using the SmartMathLibrary. Now that we have the results we should plot them to get a sense of where these words and documents lay on a two dimensional Cartesian plane.
Jennifer Flynn’s presentation “Latent Semantic Indexing Using SVD and Riemannian SVD” actually goes on to tell us how to do this. Essentially the process is the same as before however, k must equal 2. We ended up with k = 2 in our previous example however, in larger examples k will more than likely be a different number. Regardless, here we want to end up with a matrix with two columns giving us our (x,y) – if you wanted to plot these items in a three dimensional space k=3 and if you find an awesome way to plot where k=5 e-mail me. The formulas we use are as follows after we have performed SVD.
Documents = U*∑
Words = V*∑
The resulting matrices give us our (x,y) co-ordinates that we can then plot. I have been using the Dundas charting library for over two years now but the library is expensive so you should go and get the free library here since Microsoft acquired them and is a free download. And again for simplicities sake, this project is just a simple ASP.NET application.
The LSI Class:
Please note that this is almost exactly the same as in the previous blog however, here at the end of the GetDocumentWordPlots function we use the formulas mention above to load the co-ordinates of the words and documents in to a double array that we will ultimately pass to the chart.
using System;
using SmartMathLibrary;

namespace LSITest
{
    public class lsi
    {
        // this returns the formated html results
        public int MyDocColumnCount;
        public int MyDocRowCount;
        public double[,] MyDocs;
        public double[,] MyWords;
        public int MyWordsColumnCount;
        public int MyWordsRowCount;
        public string ToPrint;

        /// <summary>
        /// LISs the test.
        /// </summary>
        public void LSITest()
        {
            //Create Matrix
            var testArray = new double[,]
                                {
                                    {1, 0, 0, 1, 0, 0, 0, 0, 0},
                                    {1, 0, 1, 0, 0, 0, 0, 0, 0},
                                    {1, 1, 0, 0, 0, 0, 0, 0, 0},
                                    {0, 1, 1, 0, 1, 0, 0, 0, 0},
                                    {0, 1, 1, 2, 0, 0, 0, 0, 0},
                                    {0, 1, 0, 0, 1, 0, 0, 0, 0},
                                    {0, 1, 0, 0, 1, 0, 0, 0, 0},
                                    {0, 0, 1, 1, 0, 0, 0, 0, 0},
                                    {0, 1, 0, 0, 0, 0, 0, 0, 1},
                                    {0, 0, 0, 0, 0, 1, 1, 1, 0},
                                    {0, 0, 0, 0, 0, 0, 1, 1, 1},
                                    {0, 0, 0, 0, 0, 0, 0, 1, 1}
                                };

            // Load array in to Matrix
            var a = new Matrix(testArray);

            // print original matrix
            PrintMatrix(a);

            // preform Latent Semantic Indexing
            GetDocumentWordPlots(a);
        }

        /// <summary>
        /// Prints the matrix.
        /// </summary>
        /// <param name="myMatrix">My matrix.</param>
        private void PrintMatrix(IMatrix myMatrix)
        {
            ToPrint += "<br /><br />";

            for (int i = 0; i < myMatrix.Rows; i++)
            {
                for (int j = 0; j < myMatrix.Columns; j++)
                {
                    ToPrint += String.Format("{0:0.##}", myMatrix.MatrixData[i, j]) + "\t";
                }
                ToPrint += "<br />";
            }
        }

        /// <summary>
        /// Gets the document word plots.
        /// </summary>
        /// <param name="myMatrix">My matrix.</param>
        private void GetDocumentWordPlots(Matrix myMatrix)
        {
            // Run single value decomposition
            var svd = new SingularValueDecomposition(myMatrix);
            svd.ExecuteDecomposition();

            // Put components into individual matrices
            Matrix wordVector = svd.U.Copy();
            Matrix sigma = svd.S.ToMatrix();
            Matrix documentVector = svd.V.Copy();

            // get value of k
            var k = 2;

            // reduce the vectors
            Matrix reducedWordVector = CopyMatrix(wordVector, wordVector.Rows, k - 1);
            Matrix reducedSigma = CreateSigmaMatrix(sigma, k - 1, k - 1);
            Matrix reducedDocumentVector = CopyMatrix(documentVector, documentVector.Rows, k - 1);

            // Recalculate the matrix
            Matrix docs = reducedDocumentVector*reducedSigma;
            Matrix words = reducedWordVector*reducedSigma;

            // Fill doc plot locations
            MyDocs = new double[docs.Rows,docs.Columns];
            for (int i = 0; i < docs.Rows; i++)
            {
                for (int j = 0; j < docs.Columns; j++)
                {
                    MyDocs[i, j] = docs.MatrixData[i, j];
                }
            }

            // Fill word plot locations
            MyWords = new double[words.Rows,words.Columns];
            for (int i = 0; i < words.Rows; i++)
            {
                for (int j = 0; j < words.Columns; j++)
                {
                    MyWords[i, j] = words.MatrixData[i, j];
                }
            }

            // Set counts for charts
            MyDocRowCount = docs.Rows;
            MyWordsRowCount = words.Rows;

            PrintMatrix(docs);
            PrintMatrix(words);
        }

        /// <summary>
        /// Creates the sigma matrix.
        /// </summary>
        /// <param name="matrix">The matrix.</param>
        /// <param name="rowEnd">The row end.</param>
        /// <param name="columnEnd">The column end.</param>
        /// <returns></returns>
        private static Matrix CreateSigmaMatrix(IMatrix matrix, int rowEnd, int columnEnd)
        {
            var copyMatrix = new Matrix(rowEnd, columnEnd);

            for (int i = 0; i < columnEnd; i++)
            {
                copyMatrix.MatrixData[i, i] = matrix.MatrixData[i, 0];
            }

            return copyMatrix;
        }

        /// <summary>
        /// Copies the matrix.
        /// </summary>
        /// <param name="myMatrix">My matrix.</param>
        /// <param name="rowEnd">The row end.</param>
        /// <param name="columnEnd">The column end.</param>
        /// <returns></returns>
        private static Matrix CopyMatrix(IMatrix myMatrix, int rowEnd, int columnEnd)
        {
            var copyMatrix = new Matrix(rowEnd, columnEnd);

            for (int i = 0; i < rowEnd; i++)
            {
                for (int j = 0; j < columnEnd; j++)
                {
                    copyMatrix.MatrixData[i, j] = myMatrix.MatrixData[i, j];
                }
            }

            return copyMatrix;
        }
    }
}
Here is the code behind for the web page that displays the chart and the matrices. Essentially we iterate through the double array pulled from the LSI class and load them in to a chart series.
using System;
using System.Drawing;
using System.Web.UI;
using Dundas.Charting.WebControl;

namespace LSITest
{
    public partial class _Default : Page
    {
        /// <summary>
        /// Handles the Load event of the Page control.
        /// </summary>
        /// <param name="sender">The source of the event.</param>
        /// <param name="e">The <see cref="System.EventArgs"/> instance containing the event data.</param>
        protected void Page_Load(object sender, EventArgs e)
        {
            var mylsi = new lsi();
            mylsi.LSITest();
            Label1.Text = mylsi.ToPrint;
            double[,] myDocs = mylsi.MyDocs;
            double[,] myWords = mylsi.MyWords;

            // Load documents
            for (int i = 0; i < mylsi.MyDocRowCount; i++)
            {
                Chart1.Series["Series1"].Points.AddXY(myDocs[i, 0], myDocs[i, 1]);
            }

            // Load words
            for (int i = 0; i < mylsi.MyWordsRowCount; i++)
            {
                Chart1.Series["Series2"].Points.AddXY(myWords[i, 0], myWords[i, 1]);
            }

            // Set title
            Chart1.Series["Series1"].LegendText = "Documents";
            Chart1.Series["Series2"].LegendText = "Words";

            // Set point colors and shapes
            Chart1.Series["Series1"].Color = Color.Red;
            Chart1.Series["Series1"].MarkerStyle = MarkerStyle.Diamond;
            Chart1.Series["Series1"].MarkerSize = 12;
            Chart1.Series["Series2"].Color = Color.Gray;
            Chart1.Series["Series2"].MarkerStyle = MarkerStyle.Circle;
            Chart1.Series["Series2"].MarkerSize = 6;
        }
    }
}
And finally here is the ASP.NET web page.
<%@ Page Language="C#" AutoEventWireup="true" CodeBehind="Default.aspx.cs" Inherits="LSITest._Default" %>
<%@ Register Assembly="DundasWebChart" Namespace="Dundas.Charting.WebControl" TagPrefix="DCWC" %>
<!DOCTYPE html PUBLIC "-//W3C//DTD XHTML 1.0 Transitional//EN" "http://www.w3.org/TR/xhtml1/DTD/xhtml1-transitional.dtd">

<html xmlns="http://www.w3.org/1999/xhtml" >
<head runat="server">
    <title>LSI Test</title>
</head>
<body>
    <form id="form1" runat="server">
    <div>
        <DCWC:Chart ID="Chart1" runat="server" Height="400px" Width="400px"
            ImageType="Jpeg">
            <Legends>
                <DCWC:Legend Name="Default" Alignment="Center" Docking="Bottom"></DCWC:Legend>
            </Legends>
            <Titles>
                <DCWC:Title Name="Title1">
                </DCWC:Title>
            </Titles>
            <Series>
                <DCWC:Series Name="Series1" ChartType="Point" MarkerBorderColor="64, 64, 64"
                    ShadowOffset="1">
                </DCWC:Series>
                <DCWC:Series Name="Series2" ChartType="Point" MarkerBorderColor="64, 64, 64"
                    ShadowOffset="1">
                </DCWC:Series>
            </Series>
            <ChartAreas>
                <DCWC:ChartArea Name="Series2">
                    <axisy interval="0.5" maximum="2" minimum="-1">
                        <majorgrid linecolor="Gray" linestyle="Dash" />
                    </axisy>
                    <axisx interval="0.5" maximum="2.5" minimum="-0.5">
                        <majorgrid linecolor="Gray" linestyle="Dash" />
                    </axisx>
                </DCWC:ChartArea>
            </ChartAreas>
        </DCWC:Chart>
        <br />
        <asp:Label ID="Label1" runat="server" Text=""></asp:Label>
    </div>
    </form>
</body>
</html>
So lets see the result!
Now obviously you could/should probably write this a different way but it gets you to where you need to be.
I would also recommend you read in Flynn’s presentation on how to compare two words/documents by using the dot product of two row vectors. Or one could also use the Euclidean Distance Score. And if you are also interested I would recommend Sujit Pal’s blog post “IR Math in Java : Cluster Visualization” for additional reading.
Related Posts
AI-Powered News Aggregator for BlueskyExploring Negative r2 in Ablation Studies
Starting a Ph.D. in Computer Science
Monte Carlo Simulations in C#
Cryptanalysis Using n-Gram Probabilities
