Backtesting With Heat Maps
May 25th, 2009 | Published in Uncategorized
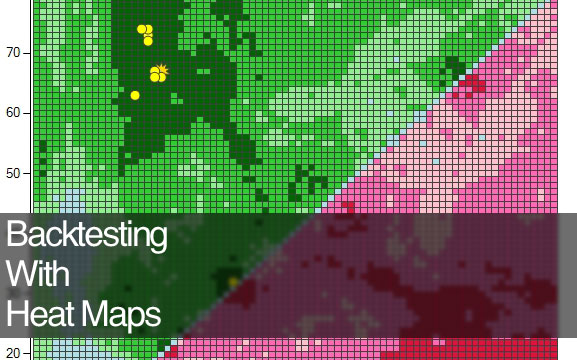
I have found that placing back test data in to heat maps and animating it over time is a great way to visualize the data. You get some cool results with some crazy patterns.
Related Posts
Exploring Negative r2 in Ablation StudiesElection Fraud: A Deep(ish) Dive
Election Fraud
Monte Carlo Simulations in C#
Apriori Algorithm